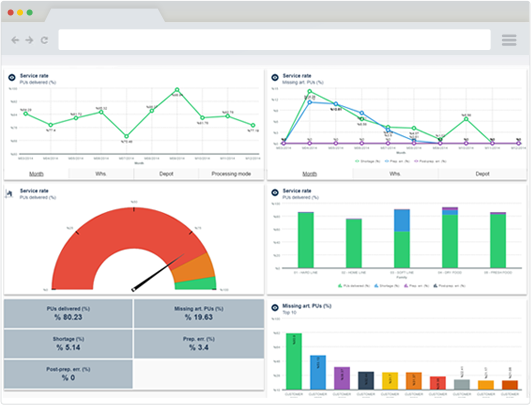
corporate reporting

based on Microsoft Power BI

Dashboard development. Data analysis. Creating an information field of companies, identifying key metrics. Formation of corporate reporting methodology

Граффік

8

years at the market

85%

projects on the recommendation

Answer business questions at the speed of thought with the BIOS

BIOS develops corporate reporting based on Microsoft Power BI

Data analysis

We compile the information field of companies, identify key metrics and indicators, form a methodology for corporate reporting

Data collection and processing

We build tools for data collection from different systems - ERP, CRM, BMP, WMS, VMS, TMS, web-service…

Data consolidation

We develop a corporate data warehouse, data update regulations

Data visualization

We develop information panels for mobile phones, Desktop browsers. We set up the distribution of reports. We are developing an API

More about services

Our choice is Microsoft, a four-time leader in business analyst solutions

A recent Gartner report shows an increase in the gap between the Microsoft leader and other solutions

2018
2019
2020
2021
Challengers
Leaders
Microsoft
Tableau
Qlik
ThoughtSpot
Domo
MicroStrategy
Google (Looker)
TIBCO Software
Oracle
Sisense
SAP
SAS
Yellowfin
Amazon Web Services
IBM
Alibaba Cloud
Pyramid Analytics
Board
Infor
Information Builders
Niche players
Visionaries

Business intelligence solutions in the world


Microsoft Power BI securely provides access to reports on Android or iOS mobile devices, in the browser, on your corporate portal


Advanced integration capabilities make it easier to consolidate data for reports from more than 100 different sources – from a variety of CRM, ERP, or web services like Google Analytics, weather, or exchange rates


Two licensing models – cloud (Power BI Premium) or local installation on your server (Power BI Report Server) – allow you to choose the best option


Using Power BI for Desktop, business analysts have the ability to receive, process, and visualize data. The studio includes the most popular visualization elements. If they are not enough, we can add custom or develop your own

What tasks does Power BI solve?

Everything related to data visualization, as well as the data conversion into information for decision making

Reports for investors

The gains: reports are updated automatically, available on mobile devices, generated without the human factor


Standard reasons for implementation:

  • Speed ​​of receiving information. The investor waits a long time for the reports, and after receiving its asks a lot of clarifying questions
  • Reporting standards. The investor requests reporting in various details, for different periods, with particular filters
  • The truthfulness of the information. A large number of digits are provided in various sections to cover all baseline and derived indicators
  • Information security. The investor asks for initial figures so that the targets are available to a limited number of people and do not differ across the company.
  • Relevance of data. To prepare reports for the investor, they are consolidated from different systems for a certain period of time
  • Mistakes of manual labor. After approving the report, it turns out that the formula has not been “extended” to the end

Factor analysis

The gains: analysis of the plans’ implementation in terms of all factors. Factor analysis is calculated automatically for any period, it is possible to analyze the factors influencing the implementation of the plan


Standard reasons for implementation:

  • Personal responsibility. The implementation of the plan is influenced by various factors for which different employees are responsible. Factor analysis makes it possible to personalize responsibility and involve motivation
  • Acceptance of risks of non-fulfillment of plans at the planning stage. Factors such as exchange rate fluctuations or state regulations need to be planned and de facto analyzed
  • Using different scenarios. Different scenarios allow you to plan with various factor values
  • Evaluation of the company’s activities. Factor analysis will provide an opportunity to separate the company’s success from temporary market factors over which the company has no influence. Exchange rate differences may increase revenue and will be a temporary factor on which there’s no need planing to increase the plan for the next period

Simple complex data visualization

The gains: the business generates a large data flow, to make a decision it’s needed to aggregate and visualize this data


Standard reasons for implementation:

  • A large amount of data. If a manager needs to analyze a report with more than 100 digits to make a decision, then this report needs to be improved
  • A waste of time. You need to systematically receive a report with basic metrics to stay on top of it. A quality report gives the answer – “is everything good or not?” at a glance. And if “not good”, then “what’s the problem?”

Data consolidation


The gains: Work with data from various sources or regions in one report


Standard reasons for implementation:

  • Branch structure. There is a task of analyzing the results of all branches according to the same criteria
  • The complex structure of accounting programs. The need to receive unified reports in all areas of activity. A specialized program is better than a universal one. Therefore, for accounting – one, and for CRM – another. Management accounting and calculation of wages in separate databases. The production has its own databases, etc.
  • Affiliate network or franchising. The need for consolidated information to calculate the performance of affiliate programs. Often partners have their own accounting systems
  • Holding or group of companies. Different businesses – different accounting systems and accounting policies, different data update regulations. Consolidated and clear reporting will help to develop in a balanced way

Comparison in the period


The gains: unlimited in time work with data


Standard reasons for implementation:

  • Sales seasonality. To analyze the best periods for the purchase of goods or their discounting and the start of the promo
  • Planning and budgeting. The use of statistics improves planning and budgeting results
  • Evaluation of the company’s activities. In times when things are changing fast, the benchmark of development analysis will be good and difficult periods to quickly and accurately assess the period in which the company is, and make decisions based on the correct assessment

Prognostication


The gains: see the future based on statistics and advanced forecasting models


Standard reasons for implementation:

  • Sales forecasting. Sales forecasting comparison with planning in several scenarios, analysis of differences, and the reality of planning assessment
  • Evaluation of the company’s performance in the future. The answer to the question “where will we be if we move at the same speed?”
  • Formation of development scenarios. Establishing different values ​​of targets to obtain various development scenarios

Standardization


The gains: reducing the cost of adapting new managers, improving the information field for management decisions, dialogue of managers as the first number


Standard reasons for implementation:

  • Reporting standardization. Work methodology formation with figures in the company, indicators on owners, coordination of uniform formulas of indicators calculations, regulation of formation efficiency and the list of persons with access, information categorization
  • Adaptation of new leaders. Knowledge of the current situation in the company begins with reports. Regulated reports provide comprehensive information, new managers start making the right decisions faster

Corporate analytics features

Compared to the self-BI approach

Corporate BI

  • Constant exchange, which guarantees data correctness. "Data Pipe"
  • Storage of business intelligence separately from transactional systems
  • Development and indicators calculation control
  • A single liability for the information quality

Self-BI

  • Self-BI. The employee can independently extract data to Excel, load it into Power BI for Desktop, create a data model, configure updates, add visualization
  • This option should be considered as an adjunct to corporate analytics

Update changes from the source

Storage and processing of information

Visualization and analysis tools

Data сonversion into information

Implementation benefits

Well-formed Power BI will tell a good story about you

Use the most complete reports in one place

Receive up-to-date reports regularly

See the group of companies reports in a unified form

Protect information from unauthorized access

Reduce staff costs to receive information

Speed up onboarding of new executives

Improve the quality of budget planning and control, work with receivables

Useful to everyone indicators

Examples of indicators for company departments

Sales Cluster

  • Plan/Fact/Forecast
    • sales
    • sales by region
    • objects
    • sellers
    • franchise network
  • Sales in
    • quantity
    • amount
    • avarage bills
    • sales per sq.m
    • receivables
  • Sales funnel
  • Receivable turnover

Production

  • Plan/Fact/Forecast
    • production
    • production by region
    • production by goods
  • Production in
    • quantity
    • amount
  • Profitability
  • Raw materials purchase plan

Financial Accounting

  • Plan/Fact/Forecast
    • budgets
    • budgets by scenarios
    • budgets by projects
  • Payment calendar
    • revenue plan
    • payment plan
    • cash gaps
    • various currencies
  • Cash Flow
  • P&L

Marketing

  • Campaign analytics
    • channel efficiency
    • traffic analysis
  • Customer segmentation
    • new and repeated
    • depending on ammount
    • depending on preferences
  • Detection of sleeping clients
  • Personal offers

Staff management

  • Motivation
    • depending on sales
    • personal bonuses
  • Search channel performance
  • Staff turnover analysis

Abandon routine in favor of strategic goals and selfdevelopment

Complete your experience with new tools and skills by filling out the form below - you'll be hearing from us soon


    Contacts

    Phone

    +380 (67) 332 30 32

    E-mail

    sales@bios.ua

    Address

    Kyiv, Sq. Sports 1-A